
You cannot improve what you do not measure. That was true when AR measurement meant a spreadsheet and a prayer, and it is still true now that every plugin dashboard promises a lift number. The harder question is what to measure against. Vendor case studies quote the wins. Almost nobody publishes the base rate.
So before the toolkit, here is the context our own database gives you. We track 68 brands that run AR or 3D commerce experiences, from IKEA and BMW down to single-store specialists. Counting those records by industry shows where AR shopping has actually been deployed, and where results get published at all.
Which industries run AR, and which ones publish results
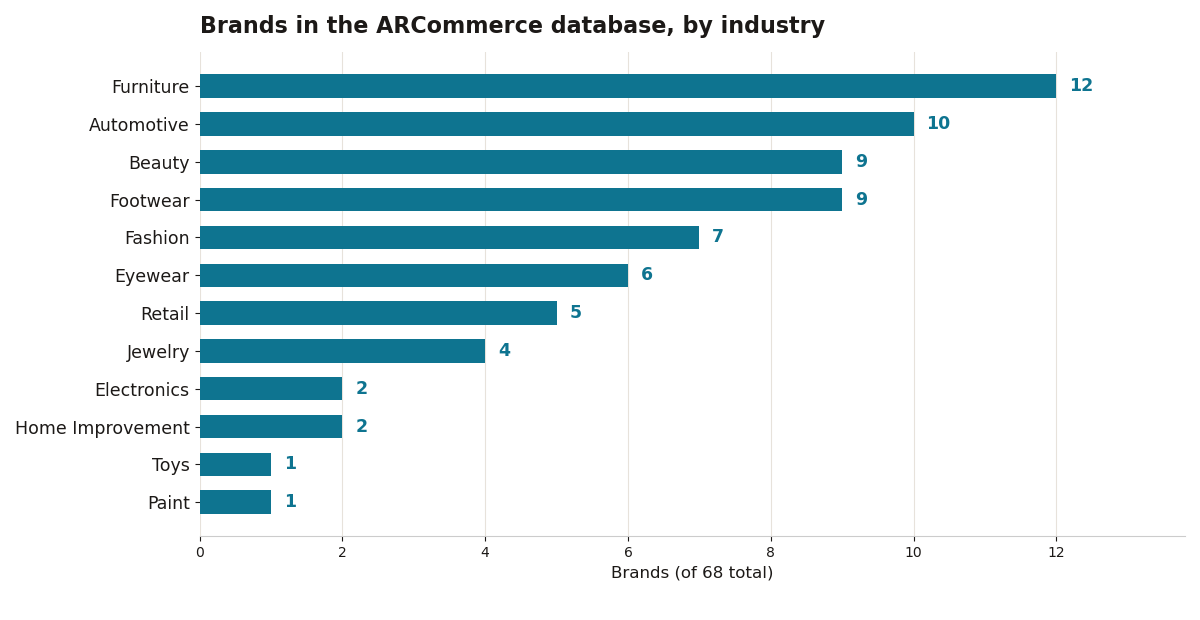
Furniture leads with 12 of the 68 brands, which fits: a sofa is the product shoppers most want to see at true size in their own room. Automotive follows with 10, then beauty and footwear with 9 each. Fashion has 7, eyewear 6, general retail 5, jewelry 4, and electronics, home improvement, toys and paint share the tail.
The measurement gap is the real story. Only 12 of the 68 brands record any result figure at all in our data, a conversion lift, an engagement lift, or both. Beauty publishes most: 5 of its 9 brands record a result. Eyewear records 3 of 6. Footwear records none of 9, and jewelry none of 4, despite both categories leaning hard on try-on. If your industry is one of the quiet ones, there is no borrowed benchmark worth trusting. Your own store data is the only benchmark you have, which makes the toolkit below the whole job.
The measurement toolkit
Five pieces cover almost every store, and none of them requires an enterprise contract:

- Store analytics first. Shopify analytics, comparing conversion rate by product before and after adding 3D or AR, is the primary metric. Everything else is supporting evidence.
- GA4 events. Track AR launches, model interactions and add-to-cart from AR sessions as custom events, so AR shoppers become a segment you can compare against everyone else.
- Plugin analytics. Third-party AR apps often report interaction time and launch counts natively. Useful, but remember the plugin is grading its own homework.
- Return rate tracking. Tag AR-viewed orders and compare their return rate against non-AR orders. This is the metric most sellers skip, and for fit-driven categories it can matter more than conversion.
- Session recordings. Watch how shoppers actually use the AR view. Confusion points, the pinch that does not rotate, the button nobody finds, show up fast.
Design the experiment before you read the results
Measurement without design produces anecdotes. Use matched product pairs: similar products, similar traffic, one with AR and one without. Run the pair for 60 days minimum, because AR novelty inflates the first two weeks. Wait for statistical significance before declaring victory, and decide in advance what lift would justify the model production cost. AR either moves conversion and returns or it does not, and the only opinion that matters is your store's data. Our longer look at AR shopping statistics shows how wide the published engagement numbers spread, which is exactly why a local test beats a borrowed average.
Pick the metric your category actually moves
Not every store should grade AR on the same number. Furniture and home goods live or die on return rates, because a sofa that looks right in the room comes back less often; conversion is the secondary story. Beauty and eyewear should watch conversion and shade-match confidence, since try-on answers a fit question before checkout. Automotive configurators are engagement machines, so interaction time and saved configurations matter more than an immediate sale. Picking the metric before the test is what separates measurement from marketing. It also decides which app earns a place on your phone: the one that reports your metric cleanly, in the same place you already check store performance every morning.
Put a model live, then measure it
None of this works until a product page carries a model worth measuring. If production cost is the blocker, start with one photo: our free turns a single product photo into a relief model you can preview, export and place on a page this week. One measured product teaches you more than fifty vendor case studies. Once it is live, the toolkit above tells you whether to scale it.
Measure first, argue later. The brands in the database that publish results are the minority. Joining them, even privately, inside your own analytics, is the actual advantage.